How does HPLC work?
A high performance liquid chromatograph is built from six main parts working together.
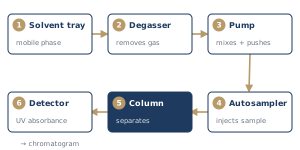
Together, these components take in a sample and output a chromatogram: a graph showing the sample's components (the target compound, or analyte, and its impurities) separated in time. In short, HPLC is a separation technique.
The solvent tray and degasser
The solvents that make up the mobile phase (e.g., water and methanol or acetonitrile) sit in individual bottles in the solvent tray atop the HPLC.
Each solvent line runs to a degasser, which removes dissolved air from the solvent before it reaches the pump, so bubbles don't form and disturb the flow or the detector signal.
The pump and autosampler
The solvent lines connect to a pump which, under software control, mixes the solvents in the ratio set by the test method developed for that sample. For example, the ratio might be 90% water and 10% acetonitrile, and it can stay fixed or change during the run.
The autosampler draws the sample from its vial and injects it into the flowing mobile phase, which carries it to the column.
The column
In one sense, the column is where the "magic" happens. It's a narrow tube packed tightly with tiny silica beads. The beads carry a surface coating (C18 is common) that forms the stationary phase.
The mobile phase carries the sample in one end of the column. On the way through, each component (the target compound and its various impurities) has a different affinity for the stationary phase.
The detector
As the mobile phase leaves the column, it passes through an ultraviolet (UV) detector. Each separated component absorbs some of the UV light as it passes through, and the detector records when it happened and how much light was absorbed.
The result is a peak. Its size reflects the amount absorbed (more compound = more absorbance), and its position is the retention time produced by the column's separation.
An example chromatogram
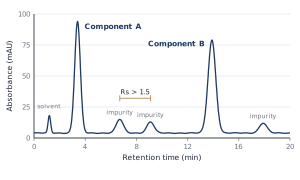
The graph above shows two main component peaks and several smaller impurity peaks. A peptide blend, such as BPC-157 and TB-500, would look like this.
This method is well designed: the resolution (Rs) between neighboring peaks is above 1.5, which means baseline separation. No peaks overlap, and each one is distinct, with no visible co-elution at the column exit. (Confirming that no hidden compound sits under a peak is the job of mass spectrometry.)
How is purity determined?
The purity on your Certificate of Analysis (COA) is a relative measurement of the target peptide against its related impurities (e.g., truncated or deletion sequences). The sample is injected, and the detector measures the area under every absorbing peak: the target and any impurities.
Purity is the main peak's area divided by the total area of all the peaks. If the main peak accounts for 95% of the total peak area, purity is reported as 95%.
How is quantity determined?
Components are told apart by their separation in time. Figuring out how much of a component is present takes a reference standard: a precisely known amount of the peptide of interest, run through the same HPLC.
Because peak area is directly proportional to concentration, the standard's peak area lets us calculate the amount of peptide in the sample.
For high accuracy, we build a multi-point calibration curve. Several known concentrations of the reference standard are prepared and injected, and a straight line (linear regression) is fit through the resulting peak areas.
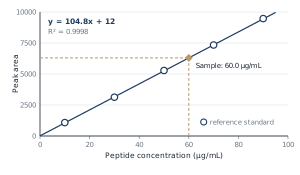
When the sample is injected, its peak area is measured and plugged into the calibration curve's equation, and the actual quantity in the sample is calculated with high accuracy.
ECA Learn articles are educational material. They describe general analytical principles and are not a substitute for a validated method or a Certificate of Analysis.