What are peptides?
Peptides are in the news for performance, sleep, weight loss, anxiety, skin health and more. So what exactly is a peptide, and why have they captured the world's attention?
Peptides are short chains of amino acids, the fundamental building blocks of proteins. In the body, amino acids link together through chemical bonds called peptide bonds.
When a chain contains roughly 2 to 50 amino acids, it's classified as a peptide. When the chain grows longer (typically 50+ amino acids) and folds into a complex 3D structure, it's classified as a protein (collagen, for example).
Many peptides act as cellular messengers. They signal specific receptors in the body to perform precise tasks, such as releasing growth hormone, stimulating skin repair, reducing inflammation, or triggering metabolic processes.
What's a small research molecule?
A small research molecule is a low-molecular-weight organic compound, typically under 900 daltons (Da), designed or used in the lab to interact with specific biological targets like enzymes, receptors or ion channels.
In drug discovery, "research molecule" usually means the chemical is being studied to understand biological pathways. Familiar small molecules include everyday drugs like aspirin, ibuprofen and caffeine.
Small molecules vs. peptides
The table below shows some of the key differences at a glance.
| Small molecules | Peptides | |
|---|---|---|
| Structure | Synthetic organic compounds built from varied chemical rings and functional groups | Chains made strictly of amino acids joined by peptide bonds |
| Size | Under 900 Da | Usually about 1,000 to 5,000 Da |
| Cell entry | Often high; many pass through cell membranes to reach targets inside the cell | Usually low; mostly act on targets on the cell surface |
| Delivery | Often stable enough to take orally as a pill | Broken down by digestion; usually injected, nasal or topical |
| Specificity | Bind small pockets on a target; higher potential for off-target effects | Large binding surface; very precise binding to target receptors |
| Stability | Generally stable; long shelf life, slower breakdown in the body | Fragile; broken down quickly by enzymes in the blood |
Testing peptides
As research interest in peptides and small molecules has exploded, so has attention on the accuracy of how they're formulated and labeled. Researchers want to know: does the vial match its label claim?
If a lyophilized (freeze-dried) vial is labeled BPC-157, 10 mg, is that accurate? How would you know?
Analytical labs like Erie Coast Analytical use high performance liquid chromatography (HPLC) and mass spectrometry (MS) to test those label claims.
HPLC and the chromatogram
An HPLC system takes in a sample, separates the target compound from its impurities, and produces a graph called a chromatogram that shows each separated component and how much of it is present.
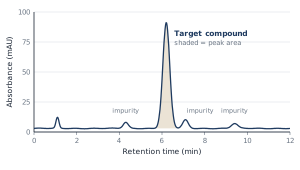
The X-axis is retention time: how long each component takes to travel through the HPLC column and reach the detector.
The Y-axis is signal intensity: the detector's response (e.g., UV light absorbance) to the target compound and any impurities.
Each peak is one separated component. A peak's position (retention time) helps indicate what the substance is, and its area tells you how much of it is in the sample.
Mass spectrometry
If HPLC gives a peak for the substance, why not stop there? Retention time alone can't prove identity, and an HPLC detector can't tell if a different compound came out at the same time (called co-elution). So a mass spectrometer is paired with the HPLC (LC-MS). The HPLC tells you how long a compound took to travel through the column; the mass spectrometer measures its mass to reveal what it actually is.
In LC-MS, the liquid leaving the HPLC is sprayed through a charged needle (electrospray ionization) into a fine mist. As the solvent evaporates, the molecules are left carrying an electric charge as gas-phase ions.
Electric fields guide the ions into a mass analyzer, which sorts them by their mass-to-charge ratio (m/z). A detector counts the ions arriving at each m/z, recording their abundance.
Reading the mass spectrum
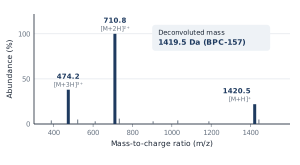
The output is a mass spectrum: ion abundance (Y) plotted against m/z (X). Software converts the peaks back into the molecule's mass. When it matches the expected mass, identity is confirmed with high confidence.
ECA Learn articles are educational material. They describe general analytical principles and are not a substitute for a validated method or a Certificate of Analysis.